US New Vehicle Prices Hit Record $51,109 Amid Slowing Inflation
Kelley Blue Book reports the average US new car transaction price reached a record $51,109, a 2.1% annual increase. While prices remain high due to tariffs and larger vehicle demand, the growth rate is below inflation. This marks the highest cost since records began, driven by supply chain issues and consumer preference for premium models.
Key points
- Kelley Blue Book, part of Cox Automotive, reports the average US new vehicle transaction price hit a record $51,109.
- The figure represents a 2.1% year-over-year increase, which is lower than the current inflation rate.
- Prices are driven by tariffs, supply chain issues, and a consumer shift toward larger, more expensive vehicles.
- The average annual price increase from 2012 to 2021 was 3.4%, making recent growth comparatively slower.
- The transaction cost includes add-ons and incentives but excludes auto loan interest rates.
Record High Transaction Costs
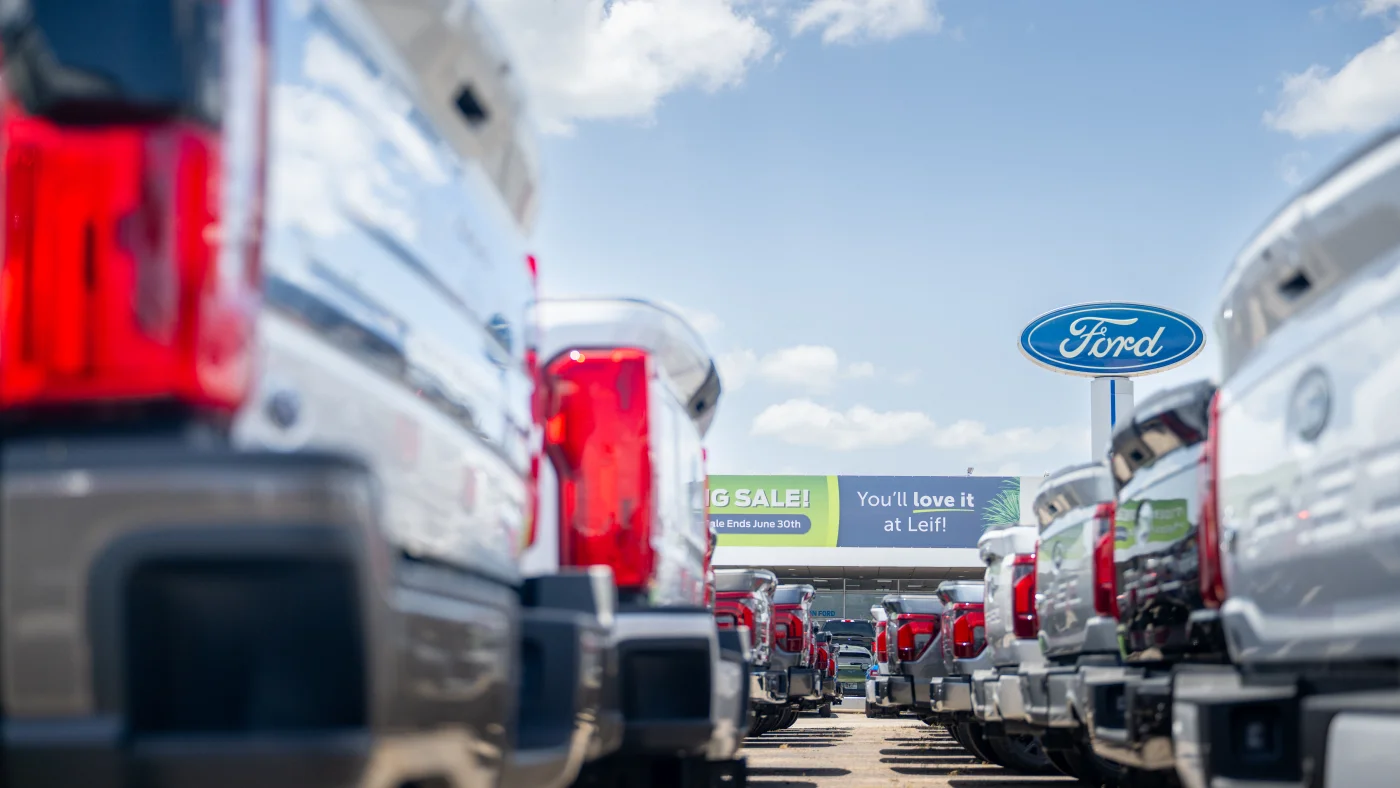
The average cost for a new vehicle in the United States has reached an unprecedented level, according to a new report from Kelley Blue Book. The analytics firm, which is a division of Cox Automotive, determined that the average transaction price for a new car is now $51,109. This figure surpasses the previous record set in December 2025 by approximately $500. The data reflects the actual amount buyers pay after accounting for dealer incentives and add-ons, providing a realistic view of market conditions rather than just sticker prices.
Slowing Price Growth
Despite the record-high absolute cost, the rate at which prices are rising has decelerated. The current price represents a 2.1% increase over the past year. Erin Keating, an executive analyst at Cox Automotive and co-author of the report, noted that this annual growth rate is actually below the current inflation rate. This marks a significant shift from the period between 2012 and 2021, when vehicle prices increased by an average of 3.4% annually. The slower pace suggests that while cars remain expensive, the aggressive inflation seen in previous years has moderated.
Drivers of High Prices
Several factors continue to keep vehicle prices stubbornly high. Supply chain disruptions, which began to impact the industry heavily during the pandemic, have had lingering effects on production and availability. Additionally, recent tariffs have added costs to the manufacturing and import processes. Consumer behavior also plays a crucial role; buyers are increasingly flocking to larger, more feature-rich vehicles. Automakers have responded by producing more of these premium models, which naturally command higher prices. The transaction cost metric captures these trends by including the cost of add-ons for fancier features while subtracting dealer discounts.
Market Context and Implications
The rise in vehicle costs affects a broad segment of the American economy. Cars are a significant purchase for many households, and higher prices can impact consumer spending in other areas. The fact that price growth is slowing below inflation is a positive indicator for affordability, even if the baseline cost remains at a historic peak. However, the exclusion of auto loan interest from the transaction cost means that the total cost of ownership is likely higher for many buyers who finance their purchases. Rising interest rates could further compound the financial burden on consumers.
Future Outlook
Analysts suggest that the trend of slower price growth may continue, provided supply chains remain stable and tariff impacts do not escalate. The shift toward larger vehicles may persist, keeping average transaction prices elevated. However, the moderation in annual increases offers some relief to buyers who have faced steep hikes in recent years. The data from Kelley Blue Book serves as a key indicator for the automotive industry, reflecting both consumer demand and manufacturer pricing strategies in a complex economic environment.
Key takeaways
- The average US new vehicle transaction price reached a record $51,109.
- This represents a 2.1% year-over-year increase, below current inflation.
- Previous annual growth averaged 3.4% between 2012 and 2021.
- Tariffs, supply chain issues, and demand for larger vehicles drive costs.
- The metric includes add-ons and incentives but excludes loan interest.
Sources
The WireByte editorial team synthesises technology news from multiple primary sources, verifies the facts, and links every source. Articles are produced with AI assistance and reviewed under our editorial policy.